Part 4 of the TNEI Innovation series
Nathanael Sims, Principal Consultant
Building insight into tomorrow’s electricity network
In Part 3 of the TNEI Innovation Series, we explored how the VoltMetric project is helping network operators gain greater visibility of voltage and power quality across their networks.
In Part 4, Nathanael Sims, Principal Consultant at TNEI, looks at another important aspect of network insight: understanding how reactive power flows are changing as the energy system evolves. Through the Reactive Power Projections project, TNEI has worked with NESO to develop a long-term projection methodology that could improve planning, support voltage management and help prepare GB’s electricity system for the challenges of a changing generation and demand mix.
What is the reactive power projections project?
Reactive power may be less visible and talked about than active power, but it plays a critical role in maintaining voltage levels and supporting the stable operation of electricity networks.
Historically, transmission networks generally supplied reactive power to distribution networks but that relationship has been reversing. Across GB, distribution networks are increasingly exporting reactive power back onto the transmission system. For example, in 2013, Grid Supply Points (GSPs) were exporting reactive power around a quarter of the time but by 2024 it was closer to three quarters. This is creating more challenges for voltage management that require different approaches.
To better understand these changing behaviours, NESO launched a Network Innovation Allowance (NIA) project, delivered by TNEI, focused on developing a robust methodology for projecting future reactive power flows at GSPs, the interface between the transmission and distribution networks. The project began by reviewing previous research, examining international approaches and assessing available data sources. The later phases developed and tested a nationwide projection model, designed so that NESO can run and refresh it as part of its own planning processes.
Why does this matter?
Growing levels of distributed generation, increasing volumes of underground cabling, changing consumer technologies and evolving demand patterns are all influencing reactive power behaviour across the network. As a result, traditional assumptions about how reactive power flows between transmission and distribution systems are becoming less reliable.
These changes can contribute to higher transmission voltages, particularly during periods of low demand, creating operational challenges for network operators and increasing the need for voltage control interventions, whether that is instructing generators to absorb reactive power, switching in reactors or contracting new services and investment in more reactive compensation. Each of these involves a cost, and that cost has been rising over the years.
A clearer understanding of future reactive power requirements is intended to help ensure the network remains secure, resilient and cost-effective as the energy transition progresses.
What did the review tell us?
The first phase of the project reviewed previous work undertaken in the UK and the key drivers behind the changing reactive power flows.
Table 1 summarises those drivers and their effect on reactive power behaviour as the energy system evolves.
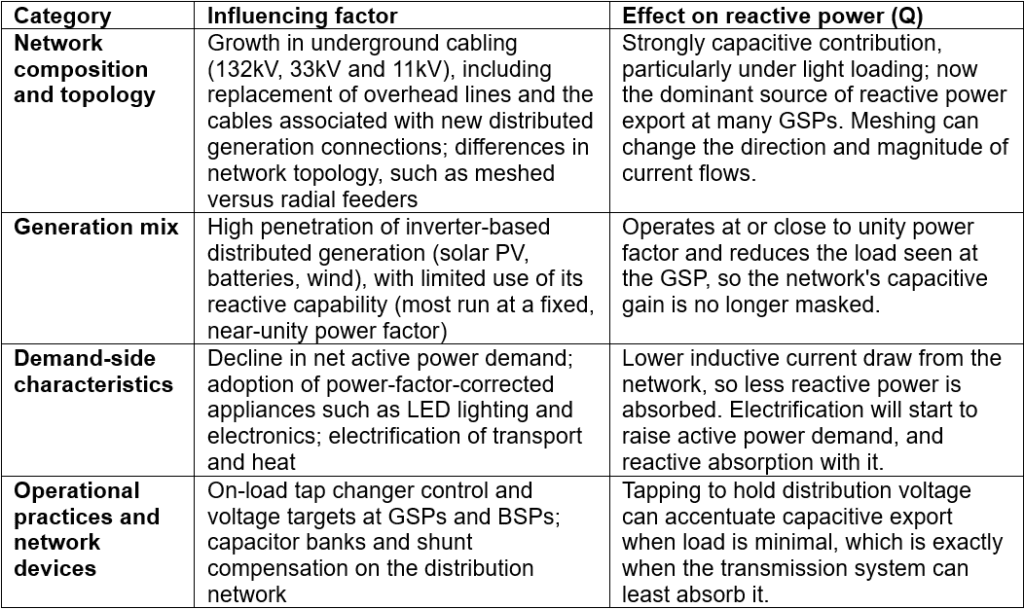
Table 1: Key drivers influencing future reactive power flows across the electricity network
The project also identified similar challenges internationally, with countries including France, Germany, Italy, Belgium, the United States and Australia all investigating how reactive power behaviour is changing in increasingly decentralised electricity systems. Few have developed long-term, scenario-based projections of the kind pioneered in the UK.
Figure 1 shows this trend in the measured data; the summer peaks, the Christmas periods and the 2020 lockdowns all stand out, which supports the link between low demand and reactive power spilling onto the transmission system.
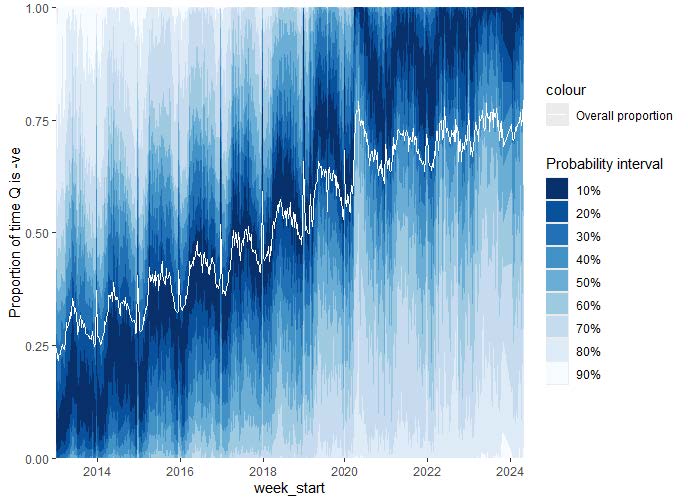
Figure 1: Increasing frequency of reactive power export from distribution networks to the transmission system across Great Britain’s grid supply points. The white line shows the proportion of time across all GSPs and the shaded bands show how widely individual GSPs vary around it.
How the projections were built
One of the most important outcomes from the review was the recognition that reactive power cannot be projected from active power demand alone. The drivers in Table 1 interact and they can vary a great deal from one GSP to the next.
Earlier GB projects relied on a mix of trend extrapolation and detailed network models, neither of which scaled easily beyond a single DNO area.
Our chosen approach was to use a combination of physics-based modelling where necessary and statistics where it needed to scale:
- Clustering of similar GSPs – all ~340 GSPs were grouped into four behavioural archetypes using unsupervised clustering on their network and demand characteristics, with each represented by a real GSP and corresponding model
- Simulate – for each archetype we ran power flow in DIgSILENT PowerFactory and calibrated against historical GSP measurements
- Emulate – a statistical emulator (a generalised additive model) was trained on those simulations so that the network’s reactive power behaviour can be reproduced in a fraction of the time, with uncertainty bands
- Scaling and projections – an adjustment model was fitted for every GSP to translate the archetype behaviour to that site, with NESO’s Future Energy Scenarios active power projections providing the inputs out to 2040
The model produces time-series reactive power projections for every GB GSP and is designed to be re-run as new Future Energy Scenarios (FES) data and network information become available.
The methodology was also presented at CIGRE with the paper winning a Best Paper award in Study Committee C1.
What the projections provide
Rather than a single answer, the model gives a structured view of how reactive power at each GSP could evolve:
- Time-series projections – reactive power at every GB GSP out to 2040 under NESO’s Future Energy Scenarios pathways with seasonal and diurnal patterns preserved
- Uncertainty bands – a range around each projection, so that a planner can see where the direction of travel is clear and where it is better to monitor and wait
- A breakdown of the drivers – how much of the projected change at a site comes from the mix of demand and generation technologies, from new cabling and from operational practice
- Sensitivity cases – key assumptions, such as the power factor at which new technologies like heat pumps and EV chargers operate, can be varied and their effect on the projections tested
The outputs should be read as projections under explicit assumptions rather than predictions, in the same spirit as the FES pathways themselves.
Building better network insight
The project provides a transparent, data-driven and scenario-based methodology that gives deeper insight into future network behaviour and supports more proactive system planning. Every assumption, from cable susceptance to the power factor of a heat pump, is explicit and can be changed, so the projections can be refreshed as the system evolves rather than rebuilt from scratch.
By improving the forecasting of reactive power, the project gives NESO and the transmission owners a firmer basis for decisions on:
- Reactive compensation investment
- The voltage control requirements placed on new connection
- The future operability of the UK transmission network
It also gives distribution network operators a view of how their own networks are likely to appear from the transmission side, especially when considering the future of distribution system operation.
How can we help?
TNEI has extensive experience in power system studies, network planning, forecasting, reactive power markets and future energy scenario assessment. This project drew on two sides of that experience which do not often sit together comprising detailed network modelling and understanding alongside data science and statistical methods. It’s that combination that made a nationwide projection practical and the same principles apply well beyond reactive power eg probabilistic curtailment and network planning under uncertainty.
Whether you’re assessing future network requirements, investigating voltage-related challenges or developing long-term forecasting methodologies, TNEI can help.
Get in touch to discuss how TNEI can support your next project