

Part 5 of the TNEI Innovation series
Nathanael Sims, Principal Consultant
Ryan Stott, Technical Consultant
Projecting data centre demand and its impact on the transmission network
In Part 4 of the TNEI Innovation series, we explored how improved forecasting and network insight can help electricity system operators better understand future reactive power behaviour.
In Part 5, Nathanael Sims and Ryan Stott explore how scenario projections, data visualisation and network modelling can help address another challenge facing the energy sector, understanding how much data centre demand may connect, where it may locate and what it could mean for the transmission network.
Through the DCConnect project undertaken for National Grid Electricity Transmission (NGET) under the Network Innovation Allowance (NIA), TNEI is developing scenario projections that bound the likely range of data centre growth, an interactive tool for exploring them and a network model to test their impact on the transmission system. While the project is focused on data centres, the same principles can be applied to other types of demand (or generation).
Why does this matter?
Data centres are fast becoming one of the largest sources of new electricity demand in Great Britain (GB). In July 2026, Ofgem reported that around 73GW of data centre capacity was in the GB connection queue, compared with current GB peak electricity demand of around 45GW. This figure is likely to have changed since, with further connection applications and ongoing queue reforms.
It’s common knowledge that not all of the data centre pipeline will be built, but the projects that are will be large and quick to develop. A data centre can move from site selection to energisation in a couple of years, far faster than the transmission reinforcement needed to supply it (which can be up to ten years or more). There’s also often a mismatch between where developers want to build and where the network has the capacity to accommodate new connections
This leaves network planners with a difficult balance: plan for too little and connections are delayed, holding back investment. Alternatively, if they plan for too much (or in the wrong places) and consumers’ fund assets that are not needed. A credible, evidence-based view of how much, where and when demand may arrive should be the starting point for getting this right.
What is DCConnect?
DCConnect is an innovation project focused on improving understanding of the potential impacts of future data centre development on Great Britain’s electricity networks.
The project is structured in four stages:
- Building an evidence base on how data centres operate, what drives where they locate themselves and how flexible their demand can be
- Expanding on the findings from stage one, generating regionalised annual data centre demand growth projections for the GB transmission network through to 2040
- Presenting these projections in an interactive tool alongside the network and citing the data behind them
- Testing their impact using a nodal model of the transmission network
Projections, not forecasts
Data centre growth is too uncertain for a single forecast to be credible. The pace of GB growth depends on a wide variety of factors, including:
- Global demand for AI and digital services
- Whether the GB remains an attractive place to build
- How many of the currently proposed projects survive
DCConnect produces projections rather than forecasts, seeking to bound the plausible range of outcomes through four TNEI scenarios (AI Gold Rush, Strong Competition, Next Generation Data Centres and AI Stagnation). Each reflects a different combination of two category of drivers, namely the global demand for AI and digital services vs the strength of the UK as a data centre market. Each projection starts from the current pipeline with realistic rates of project attrition and delay applied.
The national projections are then allocated across 24 zones of the GB transmission network (22 being in NGET’s area), based on where development is currently concentrated, each zone’s attractiveness against the siting drivers identified in the first stage, and indicative network headroom.
Network headroom is considered a factor influencing where demand may locate, rather than as a fixed limit on projected demand. This allows the subsequent network assessment to test whether the network can accommodate demand in the locations where it is projected to emerge.
What have we learned so far?
The first two stages of the project have produced several findings that are directly relevant to how networks plan for data centre growth.
The connection queue is a poor guide to what will be built
Once realistic rates of project attrition and delay are applied, our scenarios project between around 5.8GW and 12.2GW of UK data centre capacity by 2035, a fraction of the capacity currently queued. That is still a several-fold increase on the current footprint, but planning against the headline queue would risk building for demand that never arrives, while planning against existing demand would leave networks well behind.
The geography is shifting away from London
Most existing capacity sits in and around London, particularly Slough, London Docklands and the western corridor, but in most of our scenarios London accounts for a smaller share of future planned development (see Figure 1). Larger facilities are increasingly proposed in the North East, Yorkshire, South Wales and Scotland, often aligned with AI Growth Zones. Several of the zones with the most indicative network headroom, such as the East Midlands, and Humber and East Yorkshire, have relatively little data centre development today.
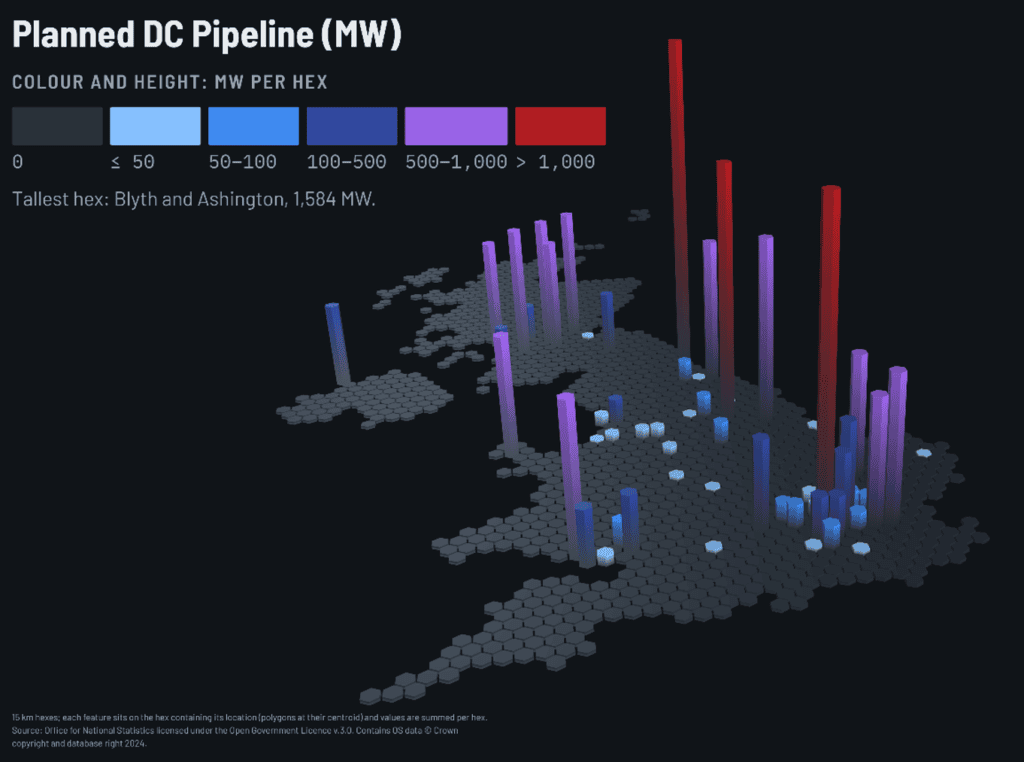
Figure 1: Regional distribution of the planned GB DC pipeline (MW)
Existing data centres use far less than their contracted capacity
Half-hourly data from more than 90 distribution-connected colocation and enterprise sites in the UK Power Networks area shows average utilisation of only 20% to 22% of contracted capacity, while mature hyperscale facilities are expected to run at 65% to 80%. Characterising future transmission-connected demand on the basis of how existing sites behave would therefore significantly understate its impact.

Figure 2: Daily average utilisation by data centre type and import voltage level, with active unit count
Demand is flat and largely unresponsive to price
Temperature is the strongest driver of variation within individual sites, with nearly three quarters drawing more in warm weather and a median uplift of around 9%. Wholesale electricity prices showed no meaningful relationship with demand. Combined with stakeholder feedback, this suggests that flexibility measures such as load shifting, co-located storage and workload migration can help at the margins but are unlikely to remove the need for timely network reinforcement.
AI introduces a different kind of load
AI training and inference workloads can swing by tens of megawatts within seconds, well below the half-hourly resolution of standard metering. Facilities of this kind have yet to connect at transmission level in GB, so their operational behaviour is an emerging question for both network planning and system operation.
An interactive tool for exploring the scenarios
The projections, and the evidence behind them, are brought together in an interactive mapping tool developed for NGET. Users can select a scenario and year to see projected data centre capacity by transmission zone, alongside the transmission network, indicative generation surplus and the siting factors that shape developer decisions, from fibre routes and water availability to AI growth zones and planning boundaries.
One of the key lessons emerging from the project is the importance of bringing together multiple data sources to understand future network requirements.
Data centre growth cannot be examined in isolation since factors such as existing transmission infrastructure, land availability, planning considerations, communications connectivity, regional demand trends and future energy scenarios all play an important role in determining where development may occur and how networks could be affected. Of these, access to grid capacity has become the dominant factor, overtaking the traditional focus on latency and fibre connectivity.
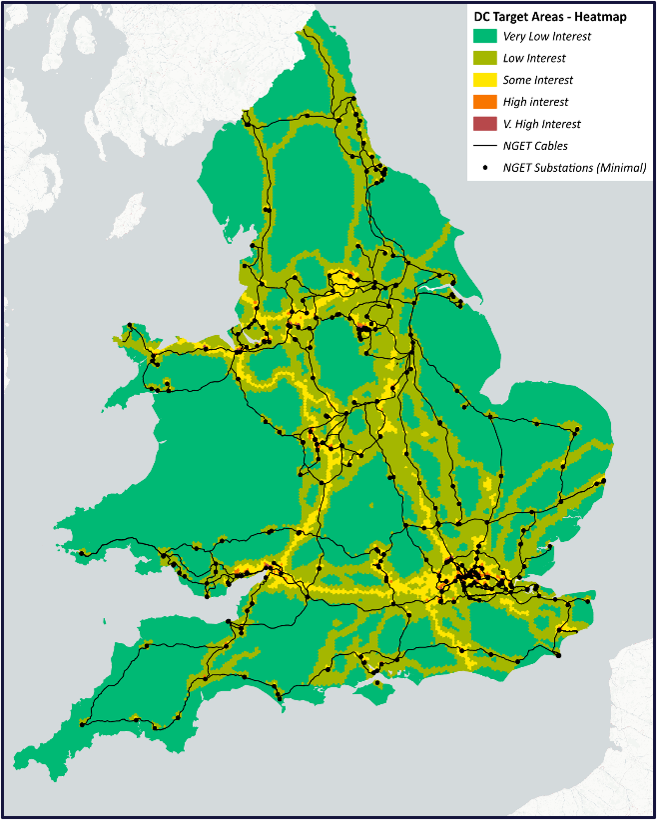
Figure 3: GIS heatmap of the UK data centre target areas with and without transmission network overlay
The project has also demonstrated the value of visualisation tools in making complex datasets more accessible. By presenting information in a clear and interactive format, stakeholders can better understand emerging trends, identify areas of interest and explore potential future scenarios.
Table 1 highlights the range of datasets being brought together to support the projections and interactive tool within DCConnect.

Table 1: Example datasets and information layers used to support DCConnect analysis and visualisation
Figure 4 shows an example of how network and demand information can be explored through the DCConnect visualisation platform.

Figure 4: Example visualisation demonstrating how network and demand data can be explored within the DCConnect platform
Testing the impact on the transmission network
Currently in progress, the final stage of DCConnect tests the zonal projections against a nodal model of the GB transmission network, with a focus on England and Wales, for 2030 and 2035. Projected data centre demand is added at transmission substations on top of a background of existing and planned generation and demand, and the network is screened to identify where circuits would be loaded beyond their capability under each scenario.
The result is an indicative view of where network constraints are most likely to arise first, how they change between scenarios and which areas could accommodate growth with the least intervention. It is designed to target more detailed studies and inform investment planning, rather than replace formal connection or compliance assessment. Alongside this, the project has reviewed the mitigation options available, from flexible and phased connections to anticipatory reinforcement, and how ongoing connections reform affects them.
How can we help?
TNEI has extensive experience in network planning, power system analysis, data visualisation, future energy scenario assessment and large demand connections.
Through projects such as DCConnect, our specialists are helping industry stakeholders turn complex datasets into meaningful insight, enabling better decision-making and more effective long-term planning.
Whether you’re planning for large new demand such as data centres, testing where and when a site can connect, assessing network constraints, developing digital planning tools or investigating emerging electricity-system challenges, TNEI can help transform data into actionable insight.
Get in touch to discuss how TNEI can support your next project

